How to lie with charts
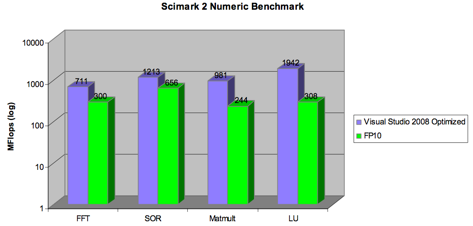
A colleague pointed me to a presentation given by Adobe at the 2008 LLVM Developers' Meeting. They're working on cross-compiling C to the Flash virtual machine, and they had a chart comparing their performance (in green) to that of VS2008 (in purple). Taller bars are better:
Looks fast, huh? Try again. They're using a log scale for the y-axis. At best, they're half the speed.
